Experience API Logs
The API logs provide an in-depth overview of your Experience API calls, including events, pageviews, clicks, and choose variation calls. They enable you to verify that your API calls are correct and identify implementation issues. You can also use logs to troubleshoot unexpected behavior.
Note that logs are near real-time, but not necessarily up to the exact moment.
To access the API Logs in Experience OS, go to Settings › API Logs.
The timeline aggregates API calls into successful calls, calls with errors and calls with warnings. Hover over a bar for more details. Under the timeline, a table lists the recent API calls that occurred in the selected time range. Scroll down to see more API calls.
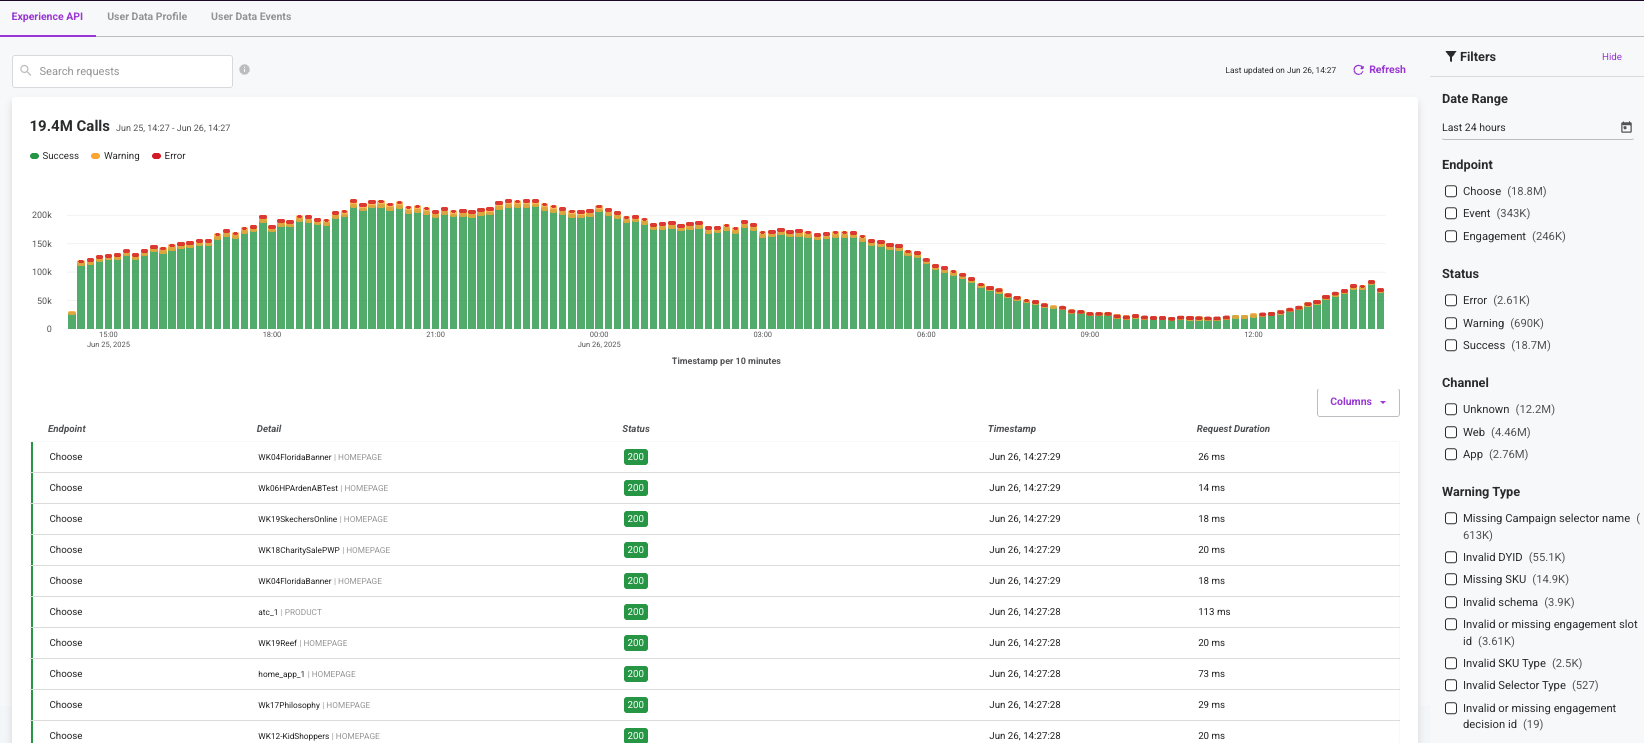
The following fields are available in the table. To display more fields, click Columns at the top of the API Logs page.
| Column | Detail |
|---|---|
| Endpoint | The type of API calls, such as choose or pageview |
| Details | Details about the request type, such as what type of event was called |
| Request ID | A unique identifier for each API call |
| Status | Displays the status code. 200 or 204 means everything was ok. Other codes are described next to the code. |
| User ID | The user ID provided in the API request |
| Session ID | The session ID provided in the API request |
| Timestamp | Displayed in seconds granularity |
| Request Duration | The time the request took in the Dynamic Yield servers (excludes time spent in transit) |
| Channel | The reported channel |
| SDK | The SDK version |
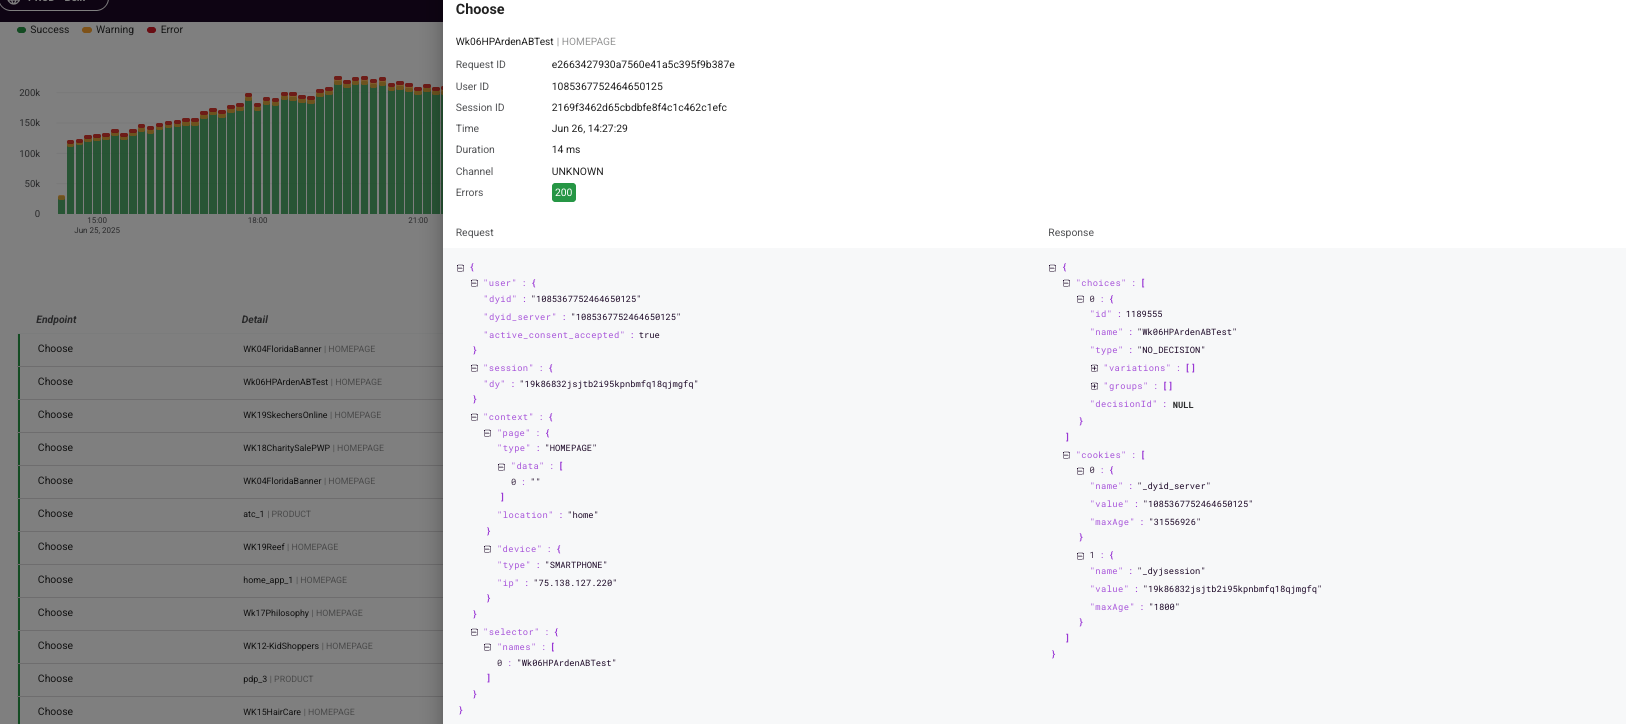
You can drill down on any API call to view more details by clicking anywhere in the row. This response is only available for logs that are under 32 KB. If the response exceeds this limit, it isn't displayed in the log.
Filter the logs
Filter by time range
You can choose a time range using the date picker in the Filters pane or by clicking and dragging on the graph.
We keep logs for 7 days, so your selected range can be up to 7 days.
Filters pane
In the Filters pane, you can filter the API calls by endpoint, status, channel, warning type, error type, or request duration. The number of calls per filter appears next to each filter option.
Multiple selections under the same filter type (say, Choose and Pageview under Endpoint) are considered as "OR"; while multiple selections under different filter types (say, Pageview under Endpoint and Error under Status) are considered as "AND".
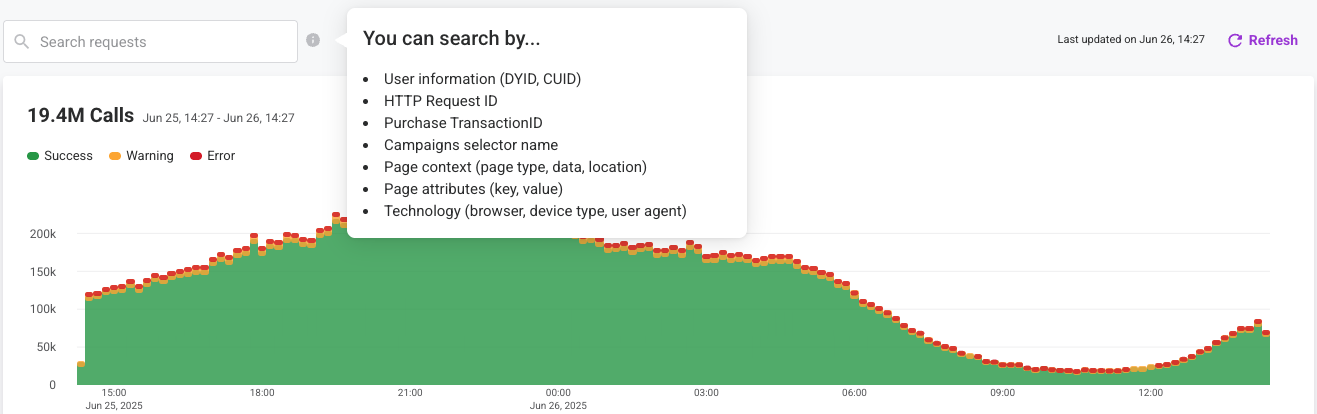
Filter by search
You can also filter by using the search tool to specify one of the following values:
| Filters apply to | Filter |
|---|---|
| All calls | - User information (DYID, UID) - HTTP request ID |
| Choose calls | - Selector name - Page context (page type, data, location) - Page attributes (keys and values) - Technology (browser, device type, user agent) |
| Events | - CUID (for identification events only) - Purchase transaction ID (for purchase events only) |
Troubleshooting use cases
| Issue | Resolution |
|---|---|
| During the initial implementation, I want to make API calls to check that all attributes are received with the intended values (context type, for example) and no warnings. | Open the API Log and monitor the incoming calls, using the refresh button to view the latest calls. |
| During implementation, I noticed there were some warnings on API calls. | Select the row in the API log to see more details. You can see the full warnings, including, for example, specific missing SKUs. You can also view the request body to see exactly how you passed the data to the API. |
| In production (or any other high-volume environment), I suspect there might be some problematic API calls, but I am not sure exactly when they're happening. | You can zoom in on a specific time range that has a high volume of errors or warnings. You can also use filters to view only API calls with the errors or warnings you're looking for. |
| On a high-volume platform, I want to see what one user is doing. | Enter their user ID in the search bar to filter the log. |
| Someone wants to tell me about an issue by sharing a bookmark or reference to the issue. | This can be accomplished by entering the User ID in the search bar. If you don’t have the user ID, enter the request ID and use that to look for the user ID in the filtered results. |
| I know there are currently errors/warnings, and I want to know “when it broke”, so I can (a) understand the scope of the problem, and (b) correlate it with any changes I made. | Zoom in to a suspected time range, and then use filters to narrow down the results to a specific error or warning type. |
| I applied a fix to an error/warning and want to check that there are no more requests with this type of issue. | Use the time-range control and/or filters to see if/when a problem stopped and whether the issue was fully or partially resolved. |
Updated 6 months ago